
Determining Wind & Snow Load Combination Factors for PV Panels
As the global PV industry expands, the structural integrity of solar arrays becomes critical. Lightweight PV systems are uniquely vulnerable to failure from combined wind and snow loads. However, most design codes lack specific guidance for these structures. This study establishes a data-driven load combination factor to improve the safety and reliability of PV system design.
Research Methodology
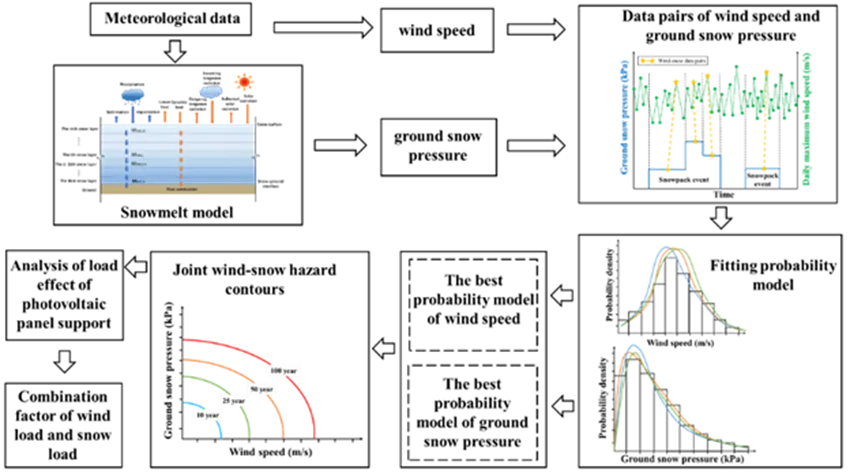
To derive a reliable combination factor, this study followed a multi-stage process. First, a multi-layer snowmelt model was used to simulate ground snow pressure in representative cities across the country. Next, four distinct methods were employed to create data pairs of corresponding wind speeds and snow pressures. These datasets were fitted with various probability models to identify the best fit for establishing combined wind-snow hazard contour lines for a given return period. The resulting load combinations were then applied to a Finite Element (FEA) model of a PV tracker to analyze structural load effects. Finally, these load effects were used to calculate the definitive wind and snow load combination factor.
Modeling & Data Acquisition
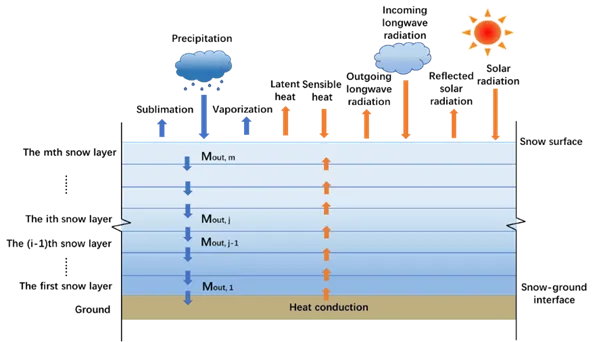
Multi-Layer Snowmelt Model
Structural snow loads in design codes are derived from ground snow pressure. Since many meteorological stations only record snow depth, this study used a multi-layer snowmelt model. By inputting weather data like precipitation, temperature, and wind speed, the model simulates the accumulation and melting processes to accurately calculate ground snow pressure throughout the winter season.
Data Pairing Methods
Using the snowmelt model and historical weather data from 40 representative cities, four methods were used to generate wind speed and snow pressure data pairs for analysis:
- Method I: Max snow pressure and max wind speed between two consecutive snowfall events.
- Method II: Max snow pressure between snowfalls and max wind speed within 3 days after a snowfall (when wind-induced drift is minimal).
- Method III: Max snow pressure and max wind speed during a single, complete snow accumulation event.
- Method IV: Absolute maximum ground snow pressure and wind speed over an entire winter.
Statistical Analysis & Hazard Contours
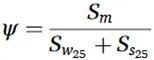
Three common probability distributions—Gumbel (Extreme Value Type I), Lognormal, and Generalized Extreme Value (GEV)—were used to fit the wind speed and snow pressure samples from each city. The optimal probability model for each was selected using the Kolmogorov-Smirnov (K-S) test and Akaike Information Criterion (AIC). Linear regression analysis confirmed that the wind and snow samples were statistically independent, allowing their joint probability to be calculated with the following formula:
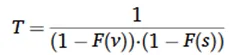
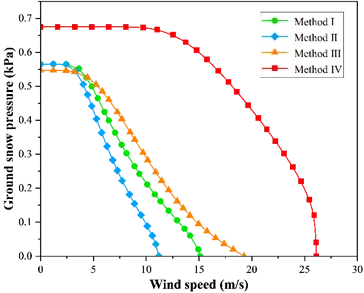
Using this principle, combined wind-snow hazard contour lines were plotted for a 25-year return period, which matches the typical design life of a PV system. The example below shows the contour lines for Urumqi, Xinjiang, based on the four data pairing methods.
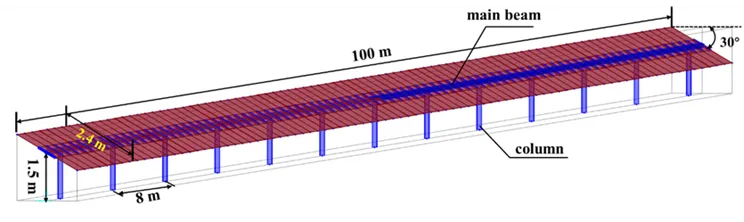
FEA Modeling & Load Scenarios
The analysis was performed on an FEA model of a single-axis tracker, 100 meters long and 1.5 meters high, set at a 30° tilt. The structure consists of a central torque tube (main beam) supported by 13 steel columns spaced 8 meters apart.
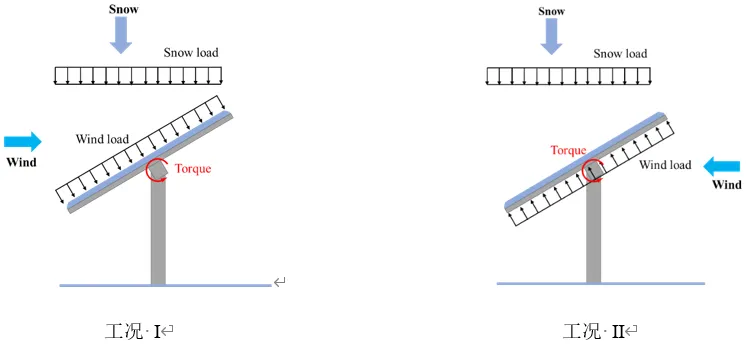
Load Application
Wind load creates both uniform pressure and torsion on the main beam. Snow load was assumed to be a uniformly distributed pressure. Two critical load combination scenarios were analyzed:
- Case I: Wind Pressure + Snow Pressure (acting in the same direction).
- Case II: Wind Suction + Snow Pressure (acting in opposing directions).
Load Effect Analysis
The standard wind and snow loads were applied to the FEA model to calculate three key load effects: maximum column axial force (N_max), maximum main beam bending moment (M_max), and maximum main beam torsion (T_max). The results for Urumqi under Load Case I are shown below.
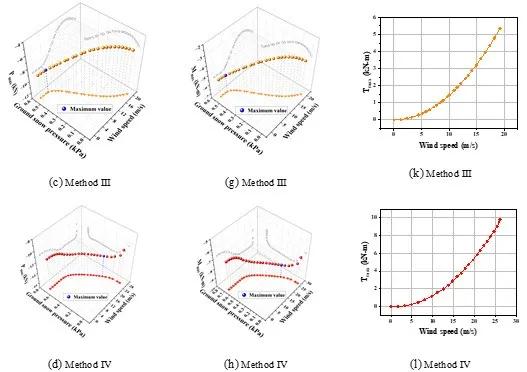
Key Finding: In Load Case I (wind and snow pressure), the effects are additive, requiring a load combination. In Load Case II (wind suction and snow pressure), the loads counteract each other, meaning a combination is not necessary as the individual loads represent the worst-case scenario.
Proposed Wind-Snow Load Combination Factor
Assuming a linear relationship between static loads and their effects, the combination factor was calculated using the following formula:
The factors were calculated for all 40 cities. The boxplot below shows the distribution of the results for Load Case I.
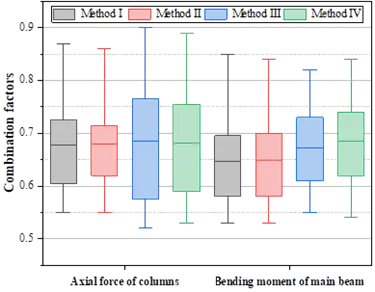
For column axial force, the mean combination factor was 0.68 across all methods. For the main beam bending moment, the mean values ranged from 0.65 to 0.69. Based on these results, a conservative and practical combination factor is recommended.
Conclusion & Recommendation
-
Load combination is necessary when wind and snow act as pressure simultaneously (Load Case I). When wind acts as suction, the loads oppose each other, and no combination is required.
-
When designing a tracker for column axial force and main beam bending moment, a wind and snow load combination factor of 0.7 is recommended.
-
Because main beam torsion is almost entirely dependent on wind load, a load combination for this effect is unnecessary.
Note: This study assumes uniform snow distribution and does not account for effects like wind-induced snow drifting, which may require further investigation for specific sites.